Changes to our Health Indicators
Many of our health indicators have become worse over the past few decades (2000-2020). There has been a decrease in the United States in life expectancy. Below are some of the indicators that have been reduced, resulting in a society that is becoming increasing unhealthy and is placing an unsustainable burden on the families and health care facilities.
Cancers
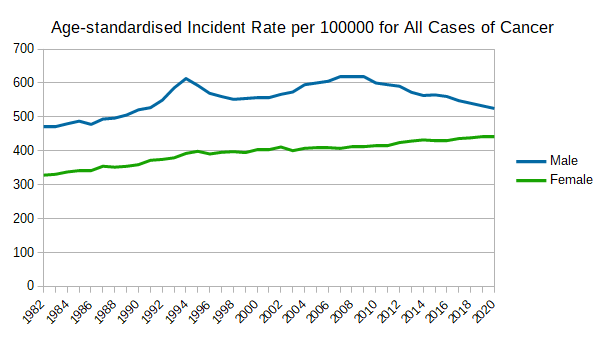
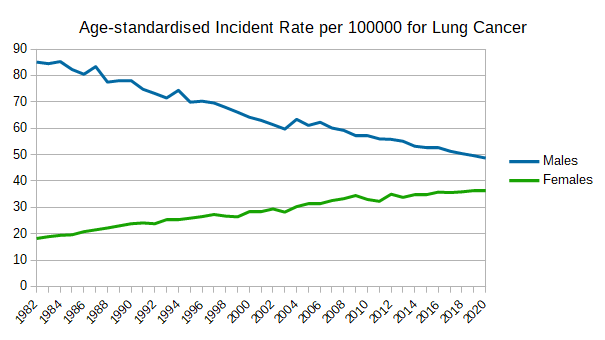
The prevalence of many cancers have continued to rise. The mortality rate for all cases of cancer has risen for females. It has decreased for males because of the reduction in lung cancer. 1
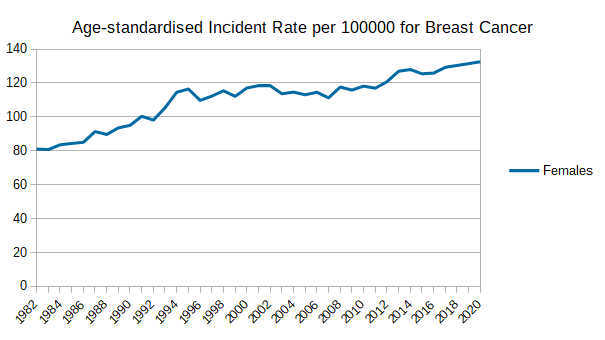
Breast cancer, a sex-hormone related cancer with a high prevalence rate, continues to rise.
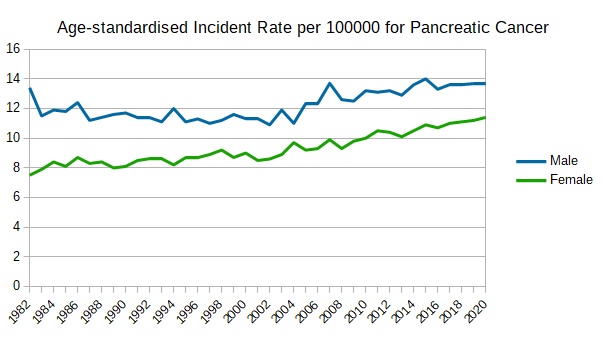
Pancreatic cancer, has a lower prevalence rate but has a high mortality rate, continues to rise unabated.
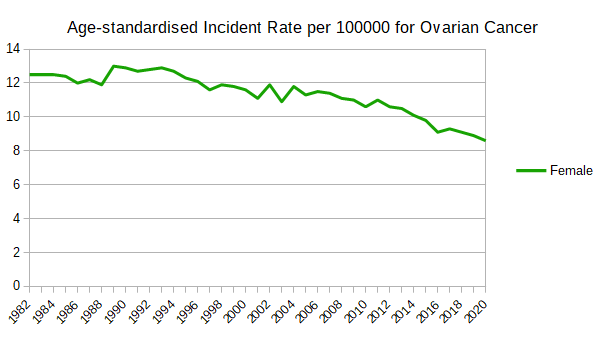
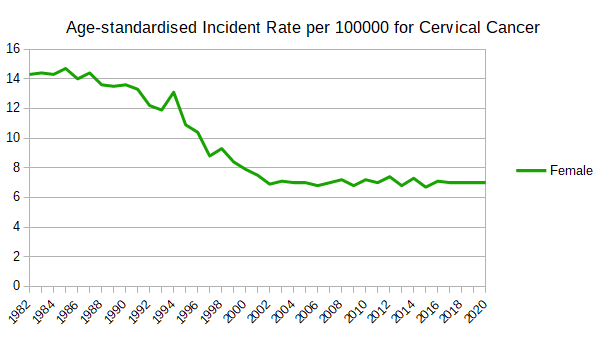
Ovarian and cervical cancer are two sex-hormone related cancers with a low prevalences rate. Whilst a substantial reduction in cervical cancer occurred between 1992-2002, there has been no reduction in the following two decades.

Obesity
In 2018, 36% of Australians aged 18 and over are overweight (BMI of 25 to up to 30) and 31% of the population are obese (BMI 30 or more). 2
High Blood Pressure
34% of adult Australians have hypertension (greater than 140/90 or taking medication). 3 According to the Framingham Risk Assessment calculator, a systolic value of less than 120 mmHg is ideal.
Autoimmune Disease
Autoimmune diseases are a pernicious group of diseases where the immune system produces antibodies that destroy the body’s cells. There are 80-100 autoimmune diseases that have been identified.
Below is a selective list of autoimmune diseases and their prevalence 4 in the United States.
| Rank | Disease | Prevalence | Per 100000 |
|---|---|---|---|
| 1 | Rheumatoid arthritis | 2,580,000 | 860 |
| 2 | Hashimoto's disease | 2,357,100 | 792 |
| 3 | Celiac disease | 2,250,000 | 750 |
| 4 | Graves' disease | 1,887,000 | 629 |
| 5 | Diabetes mellitus, type 1 | 1,440,000 | 480 |
| 8 | Parkinson's disease | 572,000 | 190 |
| 12 | Multiple sclerosis | 174,900 | 58 |
| 15 | Ulcerative colitis | 90,000 | 30 |
| 16 | Crohn's disease | 75,000 | 25 |
| 17 | Scleroderma | 72,000 | 24 |
Autoimmune diseases cumulatively affect 5-10% of the industrial world population and are a significant cause of morbidity and mortality. 5
World-wide, the incidence of autoimmune diseases is increasing at the rate of 19% each and every year. 6
Multiple Sclerosis – an Autoimmune Disease
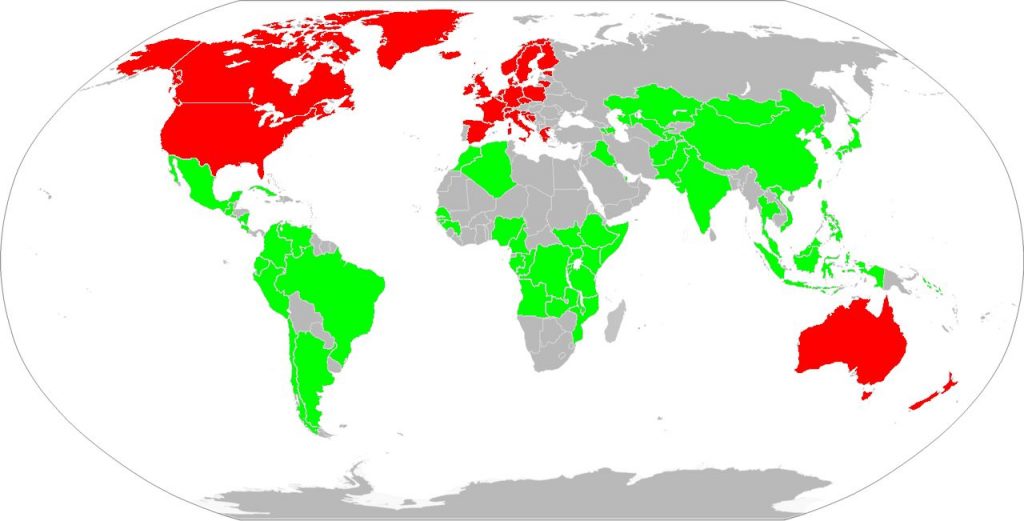
The map shows the countries with the highest (>= 0.5 / 100,000) and lowest (< 0.1 / 100,000) rates of mortality from multiple sclerosis. 7
There are a number of island nations that are too small to show on the map, most notably islands in the Caribbean and Pacific. A full list of countries, denoted by ISO country codes, is found in the following footnotes. 8 9
There is a much greater variation with the prevalence of multiple sclerosis. 10
| Country | Rate per 100,000 |
|---|---|
| Zimbabwe | 0.5 |
| Japan | 4.0 |
| Australia | 63.8 |
| New Zealand | 81.3 |
| United States | 91.7 |
| Iceland | 105.1 |
| Ireland | 125.0 |
| Sweden | 134.8 |
| United Kingdom | 143.8 |
Even within countries, there can be significant regional variations. In the United Kingdom, the Orkney Islands in the far north has a rate of 193, whilst the Guernsey Islands has a rate of 74. Oslo, capital of Norway in the SE has a rate of 132, compared with 75 in SW and 21 in the far north. 11
Parkinson’s Disease – an Autoimmune Disease
There is much evidence that Parkinson’s Disease is an autoimmune disease. 12
A 2018 paper, The Emerging Evidence of the Parkinson Pandemic, 13, states:
Type 2 Diabetes
5.3% of Australian adults aged 18 and over had type 2 diabetes in 2017–18. Diabetes is the fastest growing chronic condition in Australia, increasing at a faster rate than other chronic diseases such as heart disease and cancer. 14
Between 25% and 35% of Australians diabetics report some form of diabetic retinopathy. 15
Alzheimer’s disease
Dementia is a syndrome in which there is deterioration in memory, thinking, behaviour and the ability to perform everyday activities.
It is not a normal part of aging. 50 million people world-wide have dementia with nearly 10 million new cases every year.
Alzheimer’s disease is the most common form of dementia contributing 60–70% of cases. 16
In 2016, the global number of individuals who lived with dementia was 43·8 million which increased from 20.2 million in 1990. This represented an increase of 117% in 16 years. Dementia was the fifth leading cause of death globally accounting for 2·4 million deaths. This could be attributed to modifiable risk factors of high BMI, high fasting plasma glucose, smoking, and a high intake of sugar-sweetened beverages. 17
A 2010 paper, Alzheimer’s Disease is Incurable but Preventable, 18 states that Alzheimer’s Disease is preventable. The risk factors are similar to cardiovascular diseases. Low education level is is also a risk factor in Western societies.
Autism
The Centers for Disease Control and Prevention (CDC) monitors the prevalence of autism in 14 states of the US for children with autism at 8 years, as this is the age of peak prevalence. It is not a representative sample of the US. The reference area represents 9% of the US population of the same age. 19
Median age at diagnosis in the reference area is 53 months which is less than the median age in the total US population.
Rates of autism have been rising dramatically. The 2010 rate is:
- 29% higher than the preceding estimate of 1 in 88 children in 2008.
- 64% higher than the 2006 estimate of 1 in 110 children.
- 123% higher than the 2002 estimate of 1 in 150 children.
Additional Reading
Life Expectancy Decreasing
In the US, life expectancy declined for 3 consecutive years (2015-2017) due primarily to an increase in mortality among working-age adults (those aged 25-64 years). Although the increase in mortality was first described among white middle-aged adults, mortality is now increasing among young and middle aged adults and in all racial groups. This increase in premature death, claiming lives during the prime working ages, has important implications for individuals, families, communities, employers, and the nation.
The recent increase in mortality among working-age adults shows no signs of receding. Obesity rates are unrelenting, drug-and alcohol-related deaths and suicide rates, already high among working-age adults, increased during the COVID-19 pandemic, and the latter has made socioeconomically and racially marginalized groups even more vulnerable. 20
Conclusion
I suspect that our health indicators have drastically fallen in recent years across most categories is due to the success of popular commentators, such as Gary Taubes, Nina Teicholz, Arne Astrup, Robert Lustig, Aseem Malhotra, Maryanne Demasi and Bradley Johnston. The food industry spends billions of dollars on questionable research and advertising to ensure that they maintain an growing market share in a saturated market.
The media eagerly reports any evidence of conflicts in medical advice, resulting in headlines such as:
- Full fat dairy and meat for a longer life
- The Questionable Link Between Saturated Fat and Heart Disease
- World Health Organisation’s recommendations on saturated fat are out of date, expert team says
In the food sections, it is very rarely that there are any healthy recipes – the majority of pictures show meat, eggs, fish, chicken, cheese and even gourmet hamburgers with sweets full of sugar and cream.

When McDonald’s run marketing campaigns for vegetarian meals, it results in an increase in the sales of hamburgers – not veggie burgers.
An article Made for Locals, in the Food & Drink section of the Newcastle Herald on 22nd May 2021, wrote about a newly opened restaurant, Lock’s Paddock, that specialises in cured meats and “theatrical” cheese-wheel pasta. The carbonara with mushroom, speck and fusilli pasta and cacio e pepe with truffle pecorino and spaghetti are served at the table. The carbonara and spaghetti in the cheese wheel are the most popular dishes. The carbonara refers to cured pork.
Egg consumption in Australia reached a high point in the early 1970s and decreased substantially until the early 2000s. 22
Whilst egg consumption has not reached the highs from the early 1970s, it has steadily increased since the early 2000s due to successful marketing campaigns by the Australian Eggs, such as “Eggs are OK everyday” and research funded by the poultry industry.
In 2018, 36% of Australians aged 18 and over are overweight (BMI of 25 to up to 30) and 31% of the population are obese (BMI 30 or more). 23
34% of adult Australians have hypertension (greater than 140/90 or taking medication). 24
According to the Framingham Risk Assessment calculator, a systolic value of less than 120 mmHg is ideal.
5.3% of Australian adults aged 18 and over had type 2 diabetes in 2017–18. Diabetes is the fastest growing chronic condition in Australia; increasing at a faster rate than other chronic diseases such as heart disease and cancer. 25
Between 25% and 35% of Australians diabetics report some form of diabetic retinopathy. 26
Something is seriously wrong and the situation is becoming worse.
Last updated on Tuesday 2 April 2024 at 20:27 by administrators

Footnotes
- Anon (n.d.) Cancer data in Australia, Data – Australian Institute of Health and Welfare [online]. (Accessed 22 May 2021).
- Australian Bureau of Statistics. (2018, December 12). Overweight and obesity, 2017-18 financial year | Australian Bureau of Statistics. https://www.abs.gov.au/statistics/health/health-conditions-and-risks/overweight-and-obesity/latest-release
- Australian Institute of Health and Welfare. (2019, July 19). High blood pressure, High blood pressure—Australian Institute of Health and Welfare. https://www.aihw.gov.au/reports/risk-factors/high-blood-pressure/contents/high-blood-pressure
- Prevalence is the proportion of disease affecting a population. It is calculated estimated the number of people with the condition. It is usually expressed as a rate per 100,000 of the population.
- Shapira, Y. et al. (2010) Defining and analyzing geoepidemiology and human autoimmunity. Journal of Autoimmunity. 34 (3), J168–J177.
- Lerner, A. et al. (2016) The World Incidence and Prevalence of Autoimmune Diseases is Increasing. International Journal of Celiac Disease. 3 (4), 151–155.
- World Life Expectancy (n.d.) World Life Expectancy – Statistics [online]. Available from: http://www.worldlifeexpectancy.com/.
- Countries with the highest mortality (highest to lowest) GB, NO, DK, IE, CH, SI, NL, AL, CA, AT, DE, US, LV, RS, SE, FI, IS, PL, LU, MK, BE, BG, GR, SK, UA, FR, HU, CZ, LT, NZ, BA, EE, AU
- Countries with the lowest mortality (lowest to highest) VC, LC, MU, GD, FJ, SG, UZ, JP, KR, PH, KE, MV, SB, PG, VU, WS, ML, KG, SS, KW, RW, CD, ST, LR, KI, TL, MG, CF, MY, CG, BI, FM, GW, GA, SO, ET, CN, AO, UG, MZ, BI, TO, VN, TZ, AZ, TJ, IQ, TH, KP, ZM, SN, ID, BH, MA, JM
- Multiple Sclerosis Information Trust (n.d.) MS prevalence data for selected countries.
- Rosati, G. (2001) The prevalence of multiple sclerosis in the world: an update. Neurological Sciences. 22 (2), 117–139.
- Arlehamn, C. S. L. et al. (2020) a-Synuclein-specific T cell reactivity is associated with preclinical and early Parkinson’s disease. Nature Communications. 11 (1), 1875.
- Dorsey, E. R. et al. (2018) The Emerging Evidence of the Parkinson Pandemic Patrik Brundin et al. (eds.). Journal of Parkinson’s Disease. 8 (s1), S3–S8.
- Australian Institute of Health and Welfare. (2020, July 15). Diabetes, Type 2 diabetes—Australian Institute of Health and Welfare. https://www.aihw.gov.au/reports/diabetes/diabetes-snapshot/contents/how-many-australians-have-diabetes/type-2-diabetes
- Diabetes Australia. (2020). Diabetes in Australia – Diabetes Australia. https://www.diabetesaustralia.com.au/about-diabetes/diabetes-in-australia/
- World Health Organization Fact Sheets (2020) Dementia.
- Nichols, E. et al. (2019) Global, regional, and national burden of Alzheimer’s disease and other dementias, 1990–2016: a systematic analysis for the Global Burden of Disease Study 2016. The Lancet Neurology. 18 (1), 88–106.
- de la Torre, J. C. (2010) Alzheimer’s Disease is Incurable but Preventable. Journal of Alzheimer’s Disease. 20 (3), 861–870.
- Centers for Disease Control and Prevention (2014) Prevalence of autism spectrum disorder among children aged 8 years-autism and developmental disabilities monitoring network, 11 sites, United States, 2010. Morbidity and mortality weekly report. Surveillance summaries (Washington, DC: 2002). 63 (2), 1-24.
- Harris, K. M. et al. (2021) High and Rising Working-Age Mortality in the US: A Report From the National Academy of Sciences, Engineering, and Medicine. JAMA.
- Gonzalez, M. (2011) A burger with fries from Red Robin Gourmet Burgers. Creative Commons Attribution-Share Alike 3.0 Unported
- Helgi Library (n.d.) Egg Consumption Per Capita in Australia Helgi Library (Accessed 16 December 2020).
- Australian Bureau of Statistics. (2018, December 12). Overweight and obesity, 2017-18 financial year | Australian Bureau of Statistics. https://www.abs.gov.au/statistics/health/health-conditions-and-risks/overweight-and-obesity/latest-release
- Australian Institute of Health and Welfare. (2019, July 19). High blood pressure, High blood pressure—Australian Institute of Health and Welfare. https://www.aihw.gov.au/reports/risk-factors/high-blood-pressure/contents/high-blood-pressure
- Australian Institute of Health and Welfare. (2020, July 15). Diabetes, Type 2 diabetes—Australian Institute of Health and Welfare. https://www.aihw.gov.au/reports/diabetes/diabetes-snapshot/contents/how-many-australians-have-diabetes/type-2-diabetes
- Diabetes Australia. (2020). Diabetes in Australia – Diabetes Australia. https://www.diabetesaustralia.com.au/about-diabetes/diabetes-in-australia/
However, the study has been funded by the dairy and beef industries.
Discover how industry-funded research is deceiving the public.

 Carbohydrates DO NOT cause diabetes
Truth and Belief

 Discover why researchers, popular commentators and the food industry is more concerned with maintaining corporate profits than ensuring that we have valid health information.
Who is going to get wealthy by encouraging people to eat their fruit and vegetables?
Featured Posts
2040 DocumentaryPop Psychology, Alice and the Concept of Evil
The Pioppi Diet
What is the Problem with Wheat?
Wheat and Inflammation
Impact of a Gluten-Free Diet
Wheat and William Davis
Glucose Tolerance
When Vegan Diets Do Not Work
7th-day Adventists and Moderation
Taiwan, Buddhists and Moderation
Worried about eating eggs?
CSIRO and Egg Consumption
How Cooking Changed Us
Deception from The BMJ