Glucose Tolerance – Comparison of High-Fat and High-Carb Diets
Way back in 1927, J.S. Sweeney assigned healthy, young medical students into four dietary groups: 1 2
- high-carbohydrate diet consisting of sugar, candy, syrup, baked potatoes, bananas, oatmeal, rice and white bread
- high-fat diet consisting of olive oil, butter, mayonnaise, egg-yolks, and cream
- high-protein diet consisting of lean meat, lean fish, and egg-whites
- the fourth group was placed on a fasting regime
The students were fed their diets for two days and a glucose tolerance test was performed on the morning of the third day.
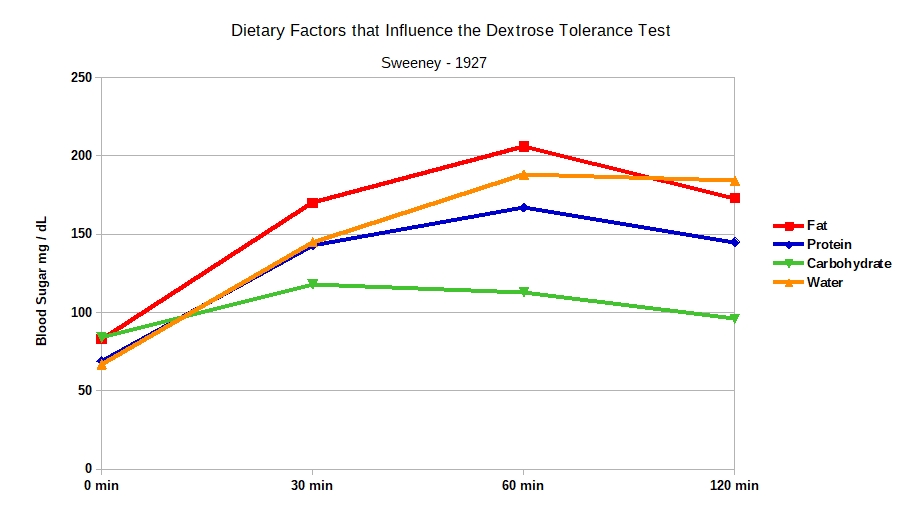
After only two days on their experimental diets, the only group showing a normal, healthy response to the glucose tolerance test was the high-carbohydrate group. Sweeney’s paper states that this diet “possessed a markedly increased tolerance for dextrose.”The protein group had slightly impaired glucose tolerance whilst the high-fat and starvation diets showed a marked decrease in their tolerance for sugar.
A graph of the responses to the 4 diets is shown below. The glycemic index is determined by the area under the graph over a 2 hour period.

Last updated on Friday 2 December 2022 at 22:00 by administrators


