Harvard Study Shows Plant Protein Consumption Reduces Mortality
There are thousands of medical and scientific papers in peer-reviewed journals showing that a whole-food, plant-based (WFPB) diets are optimal for our health and are also the best for the environment and for the animals we share the earth with.
A number of these studies are documented on this website.
There are many more studies purporting that eggs, dairy, chocolate and even red meat are healthy and even essential for health.
When a comparison is made between two or more groups of people, showing that healthy WFPB are detrimental, be mindful of the nature of the comparison group.
Almost invariably those studies justifying a high-fat, high-protein, animal-based diet have the comparison group as a “low-fat” diet of approximately 30% which is not a low-fat diet. The participants are very overweight with an average BMI of over 25 (overweight) or even over 30 (obese) BMI. These people are usually placed on energy-restricted diet that makes them feel miserable – no-one likes to be starved. At the end of the study, which is usually short term period, the participants of both groups are still unhealthy.
Other studies claim that vegetarians or vegans only appear to be healthier because of other lifestyle factors. They are more likely to exercise, smoke and drink less alcohol and are less likely to be overweight. It is claimed that these factors are more important than being vegetarian of vegan.
These “researchers” seem to forget that diet does determine how much you weigh. It is NOT an independent factor. If you are NOT overweight, you are more likely to be involved in physical activity.
One other trap in choosing a normal western population as the comparison group is that it is normal to die of heart disease, stroke and cancer. Unfortunately the high prevalence of autoimmune diseases, high-blood pressure and diabetes is normal.
The Multiple Risk Factor Intervention Trial (MRFIT) was a coronary heart disease prevention trial that was conducted at 22 US clinical centres (18 cities) from 1973 to 1982. The multiple risks evaluated were:
- elevated serum cholesterol
- elevated blood pressure
- cigarette smoking
This provided researchers with a group that had standardised serum cholesterol measurements and long-term (6 years) mortality follow-up.
For these men that were initially screen for the MRFIT cohort, low risk was defined as:
- Serum cholesterol lower than 200 mg/dL [5.2 mmol/L]
- Systolic blood pressure 120 mmHg or lower
- Distolic blood pressure 80 mmHg or lower
- non-smoking
- no history of treatment for diabetes
- no previous heart attack
- BMI lower than 25 kg/(m•m)
Not many people met the above criteria – nor do they do today.
A 2016 study, Association of Animal and Plant Protein Intake With All-Cause and Cause-Specific Mortality, from Harvard included 131,342 participants from the Nurses’ Health Study (1980 – 2015) and the Health Professionals Follow-up Study (1986 – 2012). 2
High animal protein intake was positively associated with cardiovascular mortality and high plant protein intake was inversely associated with all-cause and cardiovascular mortality.
The Recommended Dietary Intake (RDI) of protein is 0.84 g/d for adult males and 0.75 g/d for adult females. This results in the RDI for protein being approximately 8-10% of energy intake.
Many people, including dieticians and doctors, assume that the RDI is the minimum amount of nutrient that we need. The RDI is two standard deviations above the estimated average requirements. This means that the RDI meets of exceeds the needs of 97.8% of the population.
There is no need to have “a little bit more, just to be safe“.
The consumption of protein in all five categories significantly exceeds the RDI for protein.
Eating more protein than required is not beneficial— it is has a negative impact.
| Criteria | Units | Group 1 | Group 3 | Group 5 | % Diff Group 1 and 5 |
|---|---|---|---|---|---|
| Plant Protein Energy Intake Range - Deciles | % energy | [0-3] | (4-5] | (6-10] | |
| Plant Protein - Median Intake | % energy | 2.6 | 4.5 | 6.6 | 154% |
| BMI | kg/(m•m) | 26.3 | 25.9 | 25.3 | -4% |
| Activity - Metabolic Equivalent | hours/wk | 17.20 | 20.50 | 25.20 | 47% |
| Alcohol | g/d | 7.90 | 7.80 | 5.60 | -29% |
| Total protein | g/d | 79.00 | 79.20 | 78.20 | -1% |
| Smoking - Current | % | 13.00 | 12.00 | 9.00 | -31% |
| Carbohydrates | g/d | 143.60 | 189.70 | 217.90 | 52% |
| Fat | g/d | 75.9 | 67.5 | 59.3 | -22% |
| Poly / Sat Fat Ratio | 0.5 | 0.6 | 0.8 | 60% | |
| Fibre | g/d | 16.6 | 19.7 | 25.4 | 53% |
| Fruit | servings/wk | 14.7 | 17 | 18.8 | 28% |
| Vegetables | servings/wk | 20.3 | 22.5 | 28.3 | 39% |
| Legumes | servings/wk | 1.3 | 1.7 | 2.8 | 115% |
| Nuts | servings/wk | 1 | 1.4 | 3 | 200% |
| Beans | servings/wk | 0.5 | 0.7 | 1.3 | 160% |
| Whole grains | g/d | 19.9 | 23.6 | 35.3 | 77% |
| Unprocessed red meat | servings/wk | 4.4 | 3.9 | 2.5 | -43% |
| Processed red meat | servings/wk | 2.1 | 2 | 1.1 | -48% |
| Chicken | servings/wk | 2.4 | 2.6 | 2.5 | 4% |
| Eggs | servings/wk | 2 | 2 | 1.6 | -20% |
| Fish | servings/wk | 1.6 | 1.9 | 2 | 25% |
| High-fat dairy | servings/wk | 8.9 | 8.1 | 5.8 | -35% |
| Low-fat dairy | servings/wk | 8.2 | 8.4 | 7.6 | -7% |
| The relationship between mortality and plant protein | |||||
Below are some observations relating to these findings.
- This study did not include participants on a vegan diet.
- Group 1 has an average plant protein intake (as percentage of energy) of 2.6% with Group 5 having 6.6% – a 154% increase.
- The differences between category 1 and category 5 for BMI (-4%), total protein intake (-1%) and chicken consumption (4%) are minor.
- The differences for other intake criteria range from moderate to very high. Some highlights include physical activity (47%), alcohol consumption (-29%), carbohydrate consumption (52%), poly / unsaturated fat ratio (60%), fibre (53%), legumes (115%), nuts (200%), beans (160%) and whole-grains (77%).
- In this study, legumes includes peas, lima beans and lentils but not beans which are in a separate category.
The graph below compares the Hazard Ratio (HR) of the consumption of plant protein based on quintiles. A quintile is a divides the data into five parts with each part represting approximately 20% of the total. It is not exactly 20% to ensure that the same values are placed in the same quintile.
The hazard ratio (HR) compares the relative risk of the outcome occuring in a group compared with the control group – group 1 in this exercise.
The horizonal line indicates the mean whilst the vertical bars indicate the confidence intervals.
The graph below show improvement in the following with an increase in plant protein.
- all-cause mortality
- cardiovascular mortality
- cancer mortality
- mortality from other causes
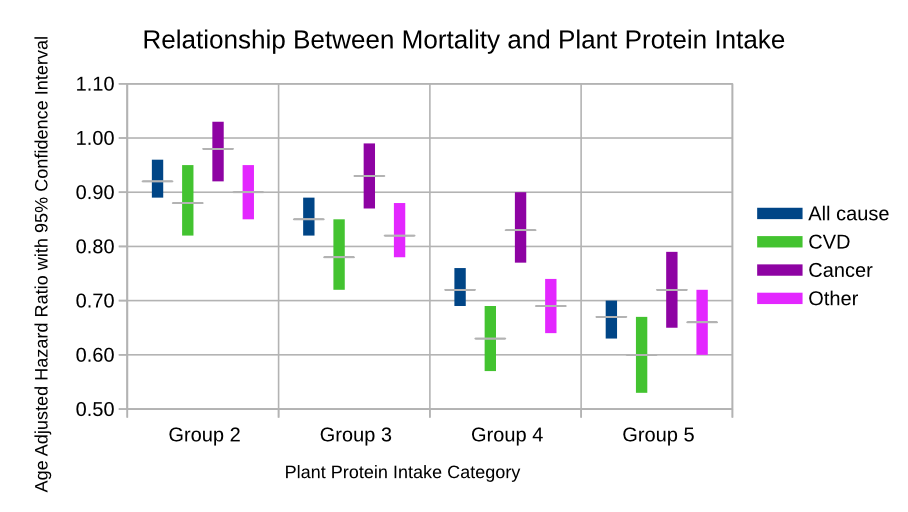
Whilst there are significant improvement in mortality with Group 5 compared with Group 1, if the comparison group is a true whole-food plant-based diet group then results are much more impressive.
Additional reading
Frances McGregor – A Deaths Door’s Patient
Seventh-day Adventists and Health
Taiwanese Buddhist Study
Glucose Tolerance – Comparison of High-Fat and High-Carb Diets
Multiple Sclerosis and Roy Swank
Lessons from the China Study
The Evidence Against Eric Westman and William Yancy
Last updated on Thursday 23 July 2026 at 13:15 by administrators
Post Type: postFootnotes
- Stamler, J. et al. (2008) The Multiple Risk Factor Intervention Trial (MRFIT)—Importance Then and Now. Journal of American Medical Association. 300 (11), 1343–1345.
- Song, M. et al. (2016) Association of Animal and Plant Protein Intake With All-Cause and Cause-Specific Mortality. JAMA Internal Medicine. 176 (10), 1453.
However, the study has been funded by the dairy and beef industries.
Discover how industry-funded research is deceiving the public.
 Carbohydrates DO NOT cause diabetes
Truth and Belief
 Discover why researchers, popular commentators and the food industry is more concerned with maintaining corporate profits than ensuring that we have valid health information.
Who is going to get wealthy by encouraging people to eat their fruit and vegetables?
Featured Posts
Why Consume a WFPB Diet?Brief Overview of WFPB Diets
Introduction
Introduction to Sex-hormonal Related Cancers and Endometriosis
Where do You Get Your Protein?
The Problem with Cow's Milk
Breast, Endometrium and Ovarian Cancers
Eating Red Meat is Not Natural
Taiwan, Buddhists and Moderation
Autoimmune Diseases, Biomimicry and Type 1 Diabetes
Glucose Tolerance
7th-day Adventists and Health
Worried about eating eggs?
How Cooking Changed Us
Deception from The BMJ
Endometriosis is Curable
Changes to our Health Indicators
Cause of Type 2 Diabetes
DNA, Genetics and Epigenetics
The Myth of Good and Bad Cholesterol
The Traditional Diet of Inuit
Wheat and the Distorted Views of William Davis