Japanese Diet, Cuisine and Health
Japan is at the top of the list for life expectancy and health. There are strong regional variations although the diet in recent decades has become more westernised and the variations in diet are becoming less distinct throughout Japan.1
A wide variety of dipping sauces accompany most meals. Udon is a thick wheat flour noodle and yakisoba is a buckwheat noodle. Soba is the Japanese name for buckwheat.
Despite the increase in dairy, egg and meat consumption in recent decades, Japan (according to the National Health and Nutrition Surveys) still consumes a predominately plant-based diet.
Hookaido had the lowest percentage of plant-based foods at 74.5% in 1980 and 82.2% in 2012. In 1980, Kanto II had the highest percentage at 78.2% with Hokuriku topping the list in 2012 with 84.5%.
Australia and the US consume approximately 30% of their diet from plant-based sources.
Hokkaido
Hokkaido is the northern most island of Japan. The winters are icy with most rivers freezing.
- Mongolian-styled barbecued lamb and vegetables.
- Hot-pot dishes (nabemono) with salmon pieces stewed with vegetables in a miso-based broth or miso soup made with salmon and vegetables,
- Miso-grilled salmon with vegetables.
- Squid sliced into very thin noodle-like strips and eaten with a dipping sauce
- Ramen wheat noodles served in a meat soup with sliced pork, nori (a seaweed) and scallions. It is often served with soy sauce or miso.
- Mazemen is a similar dish without the broth.
Tohoku region
Tohoku is the northern part of Honshu consisting of the prefectures of Aomori, Iwate, Miyagi, Akita, Yamagata, Fukushima.
- Clear soup of thinly sliced sea urchin roe and abalone from the Pacific coast of Aomori Prefecture
- Cod or salmon gut and vegetable soup from Aomori and Akita Prefectures
- Soy-based soup containing baked rice cake and vegetables from Aomori Prefecture
- cold Soba (buckwheat) noodle soup from Iwate Prefecture
- Rice dishes cooked in a salmon and salmon caviar and soy stock
- Grilled pounded rice cakes that are eaten with miso or stewed with chicken and vegetables
- Okonomiyaki is a savory pancake containing a variety of ingredients in a wheat-flour-based batter. Okonomi, means “how you like”.
Tokai and Kanto regions
Kanto is the region around Tokyo and to Tokyo’s north-west consisting of the prefectures Saitama, Chiba, Tokyo, Kanagawa, Ibaragi, Tochigi, Gumma, Yamanashi, Nagano.
Tokai (or Chubu) region os to the south of Tokyo consisting of Aichi, Gifu, Mie and Shizouka.
- Inago (a type of grasshopper) is stewed in sweetened soy. This is (or was) found in rural communities in Yamagata, Nagano and Gunma Prefectures.
- Udon noodles stewed in a miso-based soup with vegetables such as pumpkin or potatoes, mushrooms and sometimes meat.
- Savoury pancakes similar to okonomiyaki but much runnier.
- Loach (an inland fish) cooked in a pot with vegetables from Tokyo.
- Sushi consists of vinegared rice with some sugar and salt and a variety of ingredients such as seafood, often raw, vegetables and occasionally tropical fruits. Sushi varies greatly.
- Sushi is made with medium-grain white rice. Usually prepared with seafood, such as squid, eel, salmon, tuna or crab meat. There are vegetarian versions. It is often served with pickled ginger, wasabi, and soy sauce.
- Trout steamed in bamboo leaves with rice from Toyama Prefecture.
- Duck or chicken pieces coated in starch and stewed with wheat gluten, mushrooms and vegetables in a soy broth from Kanazawa Prefecture
- Deep-fried pork cutlet, egg, vegetables and condiments with rice from Komagane, Nagano and Fukui Prefectures.
- Udon stewed in broth flavoured with soy-miso
- Pork cutlets with a miso-based sauce.
- Clams dishes in Kuwana Prefecture.
Kansai and Chugoku regions
Kansai (or Kinki) is the region in and around Osaka in southern Honshu consisting of Kyoto, Osaka, Hyogo, Nara, Wakayama and Shiga.
Chugoku is in western Honshu consisting of the prefectures Yamaguchi, Shimane, Okayama, Hiroshima and Yamaguchi.
- Osaka-style refers to food where ingredients are mixed into the batter before grilling.
- Hiroshima-style refers to food which is made from layers batter, cabbage, toppings, yakisoba (fried buckwheat) and fried egg.
- Kombu (a seaweed) simmered with tofu from Kyoto.
- Deep-fried tofu.
- Savory pancakes (another type of Okonomiyaki) with cabbage, meat or seafood with Japanese Worcestershire sauce and mayonnaise.
- akoyaki – balls of grilled, savory batter with pieces of octopus inside from Osaka.
- Nabemono dishes of oysters, tofu and vegetables stewed in a miso-based broth with either wheat or buckwheat noodles.
Shikoku
Shikoku is the island south of Honshu consisting of Tokushima, Kagawa, Ehime and Kochi.
- Finely chopped tuna mixed with chopped spring onion and seasoned with rice vinegar.
- Udon noodles.
- Sashimi and sushi dishes
- Dried broad beans marinaded overnight in a mixture of soy sauce, sugar, mirin and sake.
- Sudachi is a tiny lime-like citrus which is mixed, grated and added to fish dishes of the Tokushima Prefecture.
Kyushu
Kyushu is the island south of Shiloku, the smallest of Japan’s large islands. It consists of Fukuoka, Saga, Nagasaki, Oita, Kumamoto, Miyazaki, Kagoshima as well as the archipelago of Okinawa.
- Nabemono (a cooking pot) dishes of chicken and vegetables cooked in broth and served with a a lemon-based dipping sauce - Fukuoka Prefecture.
- Nabemono dish of beef or pork offal - Fukuoka Prefecture.
- Hakata ramen - noodles served in (pork bone stock soup with toppings such as pickled ginger, sesame seeds and picked greens.
- Spicy fish eggs - Fukuoka Prefecture.
- Nabemono dishes of ramen noodles, seafood and vegetables - Nagasaki Prefecture.
- Fried battered chicken dipped in a vinegary sauce and served with tartar sauce - Miyazaki Prefecture.
- Miso or a soy sauce-based soup containing wheat noodles as well as vegetables, shimeji mushrooms and pork.
- Pork belly, stewed in sweetened soy-based broth until very soft (Nagasaki and Kagoshima).
- Chicken soup with rice from the Amami Islands south west of Kyushu.
- Pork belly and ribs, stewed for several hours alongside konnyaku (a yam) and daikon (a radish) in a broth containing miso, brown sugar and shochu (an alcoholic spirit).
- Sushi which uses rice flavored with sake instead of the usual rice vinegar. Served with shrimp, sea bream, octopus, shiitake mushrooms, bamboo shoots and shredded omelette.
- Toriten - a tempura chicken that is dipped in a soy sauce based sauce - Oita Prefecture.
Okinawa
Although Okinawa is a part of South Kyushu, their isolation ensures that diet and culture is distinct from the rest of Japan. Okinawans have one of the healthiest populations on earth, exceeded only by vegan southern Californian Seven-day Adventists.
Okinawa prefecture is an archipelago consisting of 160 islands south of Kyushu that extends for 1,000 kilometres (620 mi) to the east of Taiwan.
- Spam is a canned cooked spiced pork and ham that was made popular as a ration by the US army during World War II. It appears to have a special place in the cuisine of Okinawa.
- Goya chanpuru (stir fry) – goya (bitter melon) stir fried with other vegetables, tofu, and either Spam, bacon, thinly sliced pork belly or canned tuna.
- Tofu chanpuru – firm Okinawan tofu stir-fried with vegetables and Spam, bacon, thinly sliced pork belly, or canned tuna.
- Chanpuru made with luffa (a cucumber-like fruit grown on a tropical vine).
- Rafute – stewed pork belly.
- Soki – stewed pork ribs.
- Okinawa soba (buckwheat)- a noodle soup vaguely resembling udon, often topped with soki.
- Naaberaa Nbushii – miso-flavored luffa stir-fry.
Japanese Dietary Regions

Japan’s National Health and Nutrition Surveys (NHNS) are the oldest national health surveys conducted. The NHNS commenced after World War II to investigate the health of the Japanese population that were suffering food shortages as a result of the war. 2
Full nutritional surveys by prefecture are rarely undertaken. The data discussed below is from the year 1980. 3
The NHNS has defined 12 dietary regions which are described below.
Below are maps of the distribution of selected food items within the Dietary Regions in the year 1992. The data refers to the regions and not the prefectures. Data for individual prefectures were not available.
Okinawa diet is higher in seaweed, spices, herbs, beans (soy, tofu and other lentils), root vegetables, yellow & green vegetables. They consume less pickles, salt-dried fish and fish than the other prefectures in their region.
Compare food and mortality rates


Changes to Japanese Diet
Below is a table that shows how the Japanese diet has changed since the 1970s. 4 5
| Year | Energy (kcal) | Protein (g) | Animal Protein (%) | Fat (g) | Animal Fat (%) | Carb (g) | Ca (mg) | Iron (g) | Vit A (IU) | Vit C (mg) | Salt (g) |
|---|---|---|---|---|---|---|---|---|---|---|---|
| 1970 | 2188 | 80 | 49 | 52.0 | 53 | 337.3 | 550 | 13.4 | 1899 | 138 | 13.5 |
| 1980 | 2119 | 78.7 | 50 | 55.6 | 48 | 309.0 | 539 | 10.4 | 1986 | 123 | 12.9 |
| 1990 | 2026 | 78.7 | 53 | 56.9 | 48 | 287.0 | 531 | 11.1 | 2567 | 120 | 12.5 |
| 2000 | 1948 | 77.7 | 54 | 57.4 | 50 | 266.0 | 547 | 11.3 | 2654 | 128 | 12.3 |
| 2012 | 1897 | 69.4 | 54 | 59.0 | 51 | 255.4 | 514 | 7.5 | 1730 | 94 | 9.5 |
| Food | Chugoku | Hokuriku | Hookaido | Kanto I | Kanto II | Kinki I 1 |
|---|---|---|---|---|---|---|
| Beef | 8% | -26% | -16% | 0% | -40% | 18% |
| Dried seafood | -52% | -34% | -75% | -58% | -56% | -46% |
| Meat | 3% | 1% | -16% | 11% | -9% | 4% |
| Mushrooms | -50% | -65% | -35% | -47% | -50% | -57% |
| Other vegetables | 2% | -15% | 28% | 15% | 28% | 6% |
| Pickles | 45% | 120% | 108% | 43% | 111% | 57% |
| Pork | -46% | -18% | -35% | -16% | -23% | -44% |
| Potato | 18% | -11% | 74% | 21% | 30% | 10% |
| Rice | -23% | -2% | -17% | -31% | -22% | -25% |
| Seaweed | -47% | -53% | -3% | -58% | -32% | -56% |
| Wheat | -27% | -7% | -20% | 1% | -21% | -7% |
| Yellow & green veg | -40% | -52% | -42% | -38% | -36% | -38% |
| Food | Kinki II | Kita- kyushu | Shikoku | Minam- Kyushu | Tohuku | Tokai |
|---|---|---|---|---|---|---|
| Beef | -9% | 47% | 8% | 34% | 4% | -61% |
| Dried seafood | -25% | -45% | -21% | -63% | -68% | -45% |
| Meat | -3% | 15% | -6% | 17% | 7% | -19% |
| Mushrooms | 1% | -61% | -58% | -62% | -60% | -17% |
| Other vegetables | 6% | 9% | 8% | 4% | 7% | 37% |
| Pickles | 47% | 110% | 113% | 126% | 65% | 217% |
| Pork | -46% | -42% | -49% | -33% | -30% | -28% |
| Potato | 9% | 38% | 15% | 26% | 16% | 26% |
| Rice | -12% | -26% | -28% | -30% | -3% | -19% |
| Seaweed | -47% | -56% | -60% | -79% | -51% | -25% |
| Wheat | -32% | -18% | -18% | -10% | 2% | -23% |
| Yellow & Green Veg | -28% | -41% | -45% | -40% | -46% | -23% |
- Pickle consumption rose in Hokuriku, Shikoke, Kyshu and Tokai.
- Yellow and green vegetables, mushroom, dried seafood and seaweed consumption decreased throughout Japan.
- Beef consumption increased at the expense of pork except in Tokai.
- Potatoes consumption increased maily due to the increased consumption of fried potato chips.
Observations
- The Japanese diet is is largely plant-based with 84% of the diet being obtained from plant sources.
- Rice products s much more popular than wheat products being consumed 2.6 times more in Kanto I and 4 times more in Hokuriku.
- Yellow-green vegetables include tomatoes, carrots, spinach and green pepper.
- Other vegetables include include cabbage, cucumber, radish. onion and Chinese cabbage.
- Pickles include pickled leaves and pickled daikon radish (takuan).
- Seafood includes raw seafood (sardines, horse mackerel, tuna, squid, octopus, shrimp and crab), dried and salted seafood as well as fish pastes.
- Pork is much more popular than beef being consumed 1.4 times greater in Kinki I and 4.5 times greater in Hokkaido.
- Potatoes include all forms of potatoes includ9ng sweet potatoes, deed-fried chips and potato chips.
- There are strong positive associations with meat and fats, mushrooms and other vegetables, mushrooms and potatoes, pork and pickles, mushrooms and seafood, dried seafood and pickles, beans and rice, rice and seafood being commonly consumed together.
- The are strong negative associations with meat and seafood, wheat and rice, beef and dried seafood, beans and wheat, beef and mushrooms, beef and pickles, beef and pork commonly not consumed together.
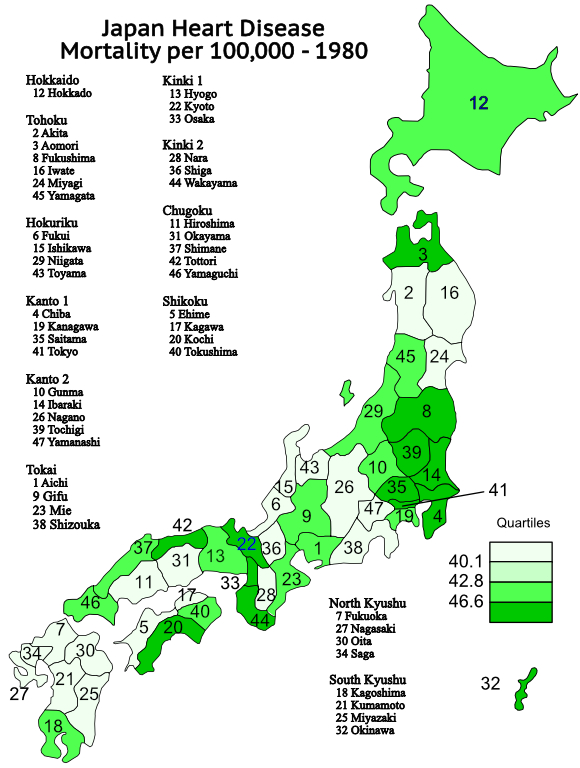
Japanese Mortality Rates
Below are the distribution of mortality rates for selected diseases. Data is available for individual prefectures but the regions are used so comparisons can be made with the food data. The food data refers to the year 2012 and the mortality data refers to the year 2015. It can take years or decades for changes in diet to reflect in changes to mortality.
There are some (but not many) substantial differences of mortality within some regions. For example:
- Chugoku: Ischaemic heart disease, minimum in Okayama (36.1), maximum in Tottori (51.7) 43%
- Tohoki: Stomach cancer, minimum in Miyagi (17.1), maximum in Akita (24.8) 45%
- Kyushu: Breast cancer, minimum in Oita (5.0), maximum in Fukuoka (6.1) 22%
The following diseases are ranked in order of their mortality rate: ischaemic heart disease (1), lower respiratory infection (2), Alzheimer's disease (3), ischaemic stroke (4), haemorrhagic stroke (6), stomach cancer (8), colorectal cancer (9), breast cancer (15).


Correlations with Diet and Mortality Rates
A 1992 paper, showed a strong correlation with the consumption of pickles, salted fish and dried fish and stomach cancer. The was also a negative correlation with consumption of yellow and green vegetables and vitamin A. It did not show a correlation with total salt consumption and stomach cancer. 6
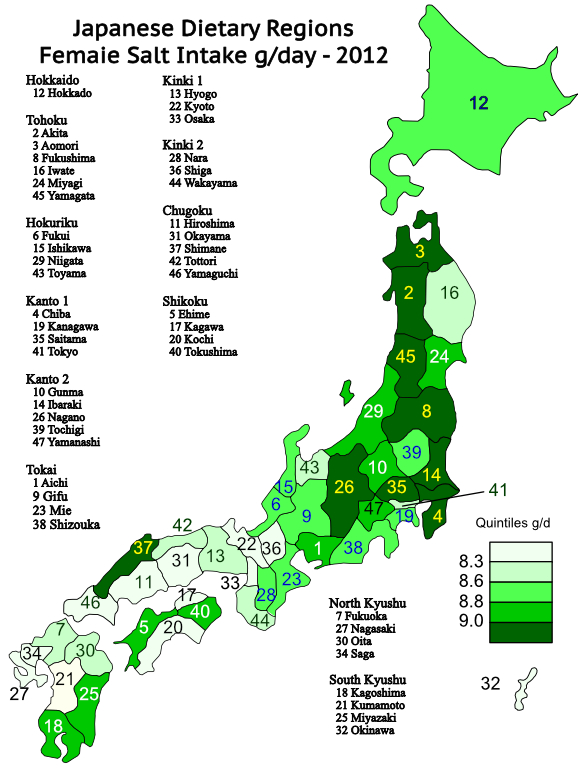
Stroke and High Blood Pressure
Salt intake had positive relationships with stroke mortality across the 12 regions. The odds ratio of stroke mortality was 1.25 for the four regions with highest salt intake compared with the lowest four regions. 7
In the 1970s, Japan had one of the highest stroke mortality rates. Average blood pressure reached its peak in the 1960s. 8
Recommendations for Consumption of Salt
Most international recommendations are based on sodium rather than salt which is confusing. Salt contains is 40% sodium. 1 g of sodium is approximately 2.5 g of salt which is equivalent to ½ teaspoons (2.5 ml) of salt.
Most recommendations are to limit salt to 5-6 g per day which is close enough to 2 teaspoons of salt per day.
Japan's intake of salt is approximately 10 g/day which has been reduced significantly since the 21 g/day in the 1950s.
The maps below show
- Female salt intake 2012
- Male salt intake 2012

Salt, Sodium and Potassium
Most of the sodium in our diets come from processed foods. Removing the salt grinder from the dining table usually does not reduce the salt intake a great deal.
Injecting chicken with salt water is a common practice in the poultry industry. According to USDA, a serving of chicken breasts weights 3 oz (85g) and contains 40 mg of sodium (100 mg of salt). The size of chicken breasts very greatly. A serving of chicken breasts is less than half of a whole chicken breasts. Most people eat a more than a serving.
Most chicken is injected with a salt solution which often results in salt levels of 1g per serve. A rotisserie BBQed chicken breast can contain 8 times more salt.
Producers have been injecting chicken with salt water since the 1970s. As well as making the chicken more succulent and tastier it is a cheap way of increasing the weight of chicken.
Chicken is not even at the top of the list for high salt foods.
According the Centers for Disease Control and the American Heart Foundation, the top 15 salt containing foods in the US are:
- Yeast breads
- Pizza
- All single code sandwiches
- Cold cuts and cured meats
- Burritos and tacos
- Soups
- All savoury snacks
- Chicken, whole pieces
- Cheese
- Eggs
- Pasta mixed dishes
- Meat mixed dishes
- Bacon processed meat sausages such as hot dogs
- Other Mexican mixed dishes
- Tomato-based condiments (tomato sauce or ketchup)
The sodium to potassium ratio appears to be even more important than sodium. Potassium increases the amount of nitric oxide in the blood nitric oxide where as sodium reduces it. Nitric oxide dilates arteries. There is less sodium and more potassium in plant-based foods. A high-sodium meal (a normal, everyday meal) impacts arterial function within 30 minutes. 9
This study used data from the 1980 survey and to evaluate the impact of dietary sodium and potassium ratio on mortality from of stroke, cardiovascular disease and all causes, using 24-year follow-up period. It did not take into account changes that participants may have made during that period.
| Criteria | Ave Mortality (per 100,000) | Ave Mortality (per 100,000) | Ave Mortality (per 100,000) | Ave Mortality (per 100,000) | Ave Mortality (per 100,000) |
|---|---|---|---|---|---|
| Q1 | Q2 | Q3 | Q4 | Q5 | |
| Sodium Potassium Ratio | 1.25 | 1.59 | 1.84 | 2.13 | 2.72 |
| Sodium Intake (mg/day) | 3818 | 4709 | 5337 | 6076 | 7482 |
| All cause mortality | 502 | 521 | 493 | 568 | 640 |
| CVD | 132 | 152 | 116 | 152 | 189 |
| Stroke | 58 | 63 | 65 | 76 | 101 |
| Ischaemic stroke | 30 | 29 | 27 | 33 | 48 |
| Haemorrhagic stroke | 17 | 18 | 25 | 17 | 31 |
- Bananas, oranges, melons, apricots, raisins, dates
- Cooked spinach
- Cooked broccoli
- Potatoes
- Sweet potatoes
- Mushrooms
- Peas
- Cucumbers
- Zucchini
- Eggplant
- Pumpkins
- Leafy greens
Comparisons with Other Countries
ICD-10 is the International Statistical Classification of Diseases and Related Health Problems. ICD-10 allows diseases to be classified with multiple levels of subcategories. The ICD-10 codes used to define the top-level categories are different to those employed below.
The ranking shown is out of 183 countries. When Japan is ranked 183 from deaths from hypertension (blood pressure diseases), it has the world’s lowest mortality rate.
Japan does perform poorly for pancreatic cancer (23), stomach cancer (23), colorectal cancer (39) and lung cancer (69). Smoking rates are much greater in Japan than Australia, Canada, US and the UK. 10
| Condition | Japan | Australia | US | Cuba | ||||
|---|---|---|---|---|---|---|---|---|
| Rank | Mortality / 100,000 | Rank | Mortality / 100,000 | Rank | Mortality / 100,000 | Rank | Mortality / 100,000 | |
| Life Expectancy (years) | 1 | 84.2 | 6 | 82.9 | 34 | 78.5 | 33 | 79 |
| Alzheimer's disease | 156 | 54.8 | 101 | 22.97 | 56 | 32.44 | 117 | 19.65 |
| Coronary heart disease | 181 | 31.55 | 175 | 43.7 | 139 | 79.21 | 132 | 91.77 |
| Stroke | 160 | 25.76 | 178 | 18.83 | 167 | 22.51 | 130 | 12.28 |
| Colorectal cancer | 39 | 14.07 | 44 | 13.48 | 64 | 11.44 | 51 | 12.9 |
| Stomach cancer | 23 | 13.35 | 149 | 3.12 | 171 | 2.56 | 109 | 4.88 |
| Lung disease | 69 | 11.61 | 131 | 17.29 | 56 | 30.74 | 94 | 22.59 |
| Breast cancer | 155 | 10.09 | 98 | 15.59 | 81 | 17.49 | 94 | 15.99 |
| Pancreatic cancer | 12 | 8.74 | 50 | 6.25 | 23 | 7.96 | 72 | 4.54 |
| Kidney disease | 156 | 6.33 | 167 | 4.61 | 124 | 10.86 | 160 | 5.5 |
| Diabetes | 182 | 3.34 | 155 | 9.6 | 134 | 15.27 | 144 | 12.09 |
| Inflammatory heart disease | 171 | 2.14 | 139 | 3.63 | 73 | 6.21 | 104 | 5 |
| Hypertension | 183 | 0.71 | 174 | 2.24 | 125 | 7.72 | 112 | 9.14 |
Last updated on Thursday 25 January 2024 at 21:16 by administrators

Footnotes
- Anon (2019) Japanese regional cuisine – Wikipedia [online]. Available from: https://en.wikipedia.org/wiki/Japanese_regional_cuisine (Accessed 15 August 2020). Creative Commons Attribution-ShareAlike License
- Ikeda, N. et al. (2015) Data Resource Profile: The Japan National Health and Nutrition Survey (NHNS). International Journal of Epidemiology. 44 (6), 1842–1849.
- National Health and Nutrition Survey (n.d.) Results of the 2012 National Health and Nutrition Survey [online]. Available from: https://www.mhlw.go.jp/bunya/kenkou/kenkou_eiyou_chousa.html.
- Katanoda, K. & Matsumura, Y. (2002) National Nutrition Survey in Japan. Its Methodological Transition and Current Findings. Journal of Nutritional Science and Vitaminology. 48 (5), 423–432.
- Riethmuller, P. & Stroppiana, R. (1996) Regional variations in diets in Japan. Pacific economic papers 257. Canberra: Australia-Japan Research Centre.
- Honjo, S. et al. (1992) Geographic correlation between stomach cancer mortality and food consumption in Japan. Journal of Epidemiology. 2 (1), 41–49.
- Tomonari, T. et al. (2011) Is salt intake an independent risk factor of stroke mortality? Demographic analysis by regions in Japan. Journal of the American Society of Hypertension. 5 (6), 456–462.
- Ueshima, H. et al. (2000) Epidemiology of hypertension in China and Japan. Journal of Human Hypertension. 14 (10–11), 765–769.
- Okayama, A. et al. (2016) Dietary sodium-to-potassium ratio as a risk factor for stroke, cardiovascular disease and all-cause mortality in Japan: the NIPPON DATA80 cohort study. BMJ Open. 6 (7), e011632.
- World Life Expectancy (n.d.) World Life Expectancy - Statistics [online]. Available from: http://www.worldlifeexpectancy.com/.
However, the study has been funded by the dairy and beef industries.
Discover how industry-funded research is deceiving the public.

 Carbohydrates DO NOT cause diabetes
Truth and Belief
 Discover why researchers, popular commentators and the food industry is more concerned with maintaining corporate profits than ensuring that we have valid health information.
Who is going to get wealthy by encouraging people to eat their fruit and vegetables?
Featured Posts
2040 DocumentaryPop Psychology, Alice and the Concept of Evil
The Pioppi Diet
What is the Problem with Wheat?
Wheat and Inflammation
Impact of a Gluten-Free Diet
Wheat and William Davis
Glucose Tolerance
When Vegan Diets Do Not Work
7th-day Adventists and Moderation
Taiwan, Buddhists and Moderation
Worried about eating eggs?
CSIRO and Egg Consumption
How Cooking Changed Us
Deception from The BMJ