CSIRO Healthy Diet Score and Egg Consumption in Australia
Australians’ usual egg consumption is a document prepared by researchers at the CSIRO. The CSIRO is the premier Australian government-funded research organisation.
The conclusion of this document states:
I sent an email on 28th October 2017 to the lead author of this document, Dr Gilly Hendrie. I have concerns regarding the methodology and conclusions of the study and requested some clarification. Hendrie is also the lead author of a number of journal articles relating to the Healthy Diet Index. The details of the email shown below. A response will be published when it is received.
A shorter version of this critique can be found at Eggs are not OK
The CSIRO Healthy Diet Score survey is an extension of the Short Food Survey which was developed by CSIRO and the University of South Australia. 1 2 The Healthy Diet Score collates self-reported dietary intakes.
The Short Food Survey is a series of 38 short questions. The scoring reflects the daily amount of fruit, vegetables, breads and cereals, meat and alternatives, dairy and dairy substitutes and discretionary foods to dietary recommendations. For the quality components, the frequency of wholegrains consumption, reduced fat dairy consumption, frequency of trimming meat, fat type of spreads used, and water consumption (as a proportion of total fluids) as well as the variety of foods.
| Category | Daily criteria : min score | Daily criteria : max score | Score | |
|---|---|---|---|---|
| Men | Women | |||
| Fruit | 0 servings | > 2 | > 2 | 10 |
| Vegetables (starches, salad, cooked) | 0 servings | 6 | 5 | 10 |
| Grains (bread, cooked cereals, breakfast) | 0 servings | 6 | 6 | 5 |
| Meat and alternatives (red meat, poultry, fish, legumes, tofu, nuts, seeds and other meat alternatives, eggs) | 0 servings | 3 | 2½ | 10 |
| Dairy (milk, cheese, yogurt) | 0 servings | 2½ | 2½ | 5 |
| Beverages (water, fruit juice, soft drinks) | 0% Water | 100% water | 100% water | 10 |
| Discretionary Choices (fried foods, savoury snacks, crackers, sweet biscuits, cakes, bars, chocolate, lollies, ice-cream, alcoholic drinks) | ≥ 3 (M) or 2½ (F) servings | < 3 servings | < 2½ servings | 20 |
| Food Quality | ||||
| • wholegrain breads | 0 | Always | Always | 5 |
| • low-fat milk | 0 | Always | Always | 5 |
| Use of healthy fats | ||||
| • trimmed meat | 0 | Always | Always | 5 |
| • margarine | 0 | Always | Always | 5 |
| Variety | ||||
| • Fruit | 0 | ≥ 4 | ≥ 4 | 2 |
| • Vegetables | 0 | ≥ 5 | ≥ 5 | 2 |
| • Dairy | 0 | ≥ 5 | ≥ 5 | 2 |
| • Protein foods | 0 | ≥ 13 | ≥ 13 | 2 |
| • Grains | 0 | ≥ 9 | ≥ 9 | 2 |
Categories of the Healthy Diet Score
Below is a summary of the responses to the CSIRO Health Diet Score Survey.
| Sample Characteristics | Count | % Sample | % Aust Pop |
|---|---|---|---|
| Male | 23,506 | 27.1 | 49.4 |
| Female | 63,105 | 72.9 | 50.6 |
| 18-30 years | 22,090 | 25.5 | 13.8 |
| 31-50 years | 32,607 | 37.6 | 28.1 |
| 51-70 years | 28,443 | 32.8 | 22.6 |
| 71+ years | 3,471 | 4 | 9.7 |
| Underweight | 2,165 | 2.5 | 1.7 |
| Normal weight | 40,937 | 47.3 | 35.5 |
| Overweight | 26,587 | 30.7 | 35.3 |
| Obese | 16,922 | 19.5 | 27.5 |
Responses of CSIRO Health Diet Score Survey
May 2015 to June 2016
Below are the sorted scores for each of the nine result categories for both male and females.
| Female | Score | Male | Score |
|---|---|---|---|
| Fluids | 93 | Fluids | 88 |
| Vegetables | 73 | Fruit | 67 |
| Meat and Alternatives | 70 | Meat and Alternatives | 66 |
| Fruit | 69 | Variety | 65 |
| Variety | 66 | Bread and Cereals | 62 |
| Bread and Cereals | 61 | Vegetables | 61 |
| Healthy Fats | 55 | Healthy Fats | 52 |
| Dairy and Alternatives | 49 | Dairy and Alternatives | 47 |
| Discretionary Foods | 33 | Discretionary Foods | 26 |
Scores of CSIRO Healthy Diet Survey for the nine result categories
| Discretionary Food | Daily | Weekly | ||
|---|---|---|---|---|
| Male | Female | Male | Female | |
| Alcohol | 1 | 0.5 | 6.6 | 3.8 |
| Cakes and biscuits | 0.4 | 0.3 | 2.5 | 2.3 |
| Chocolate and confectionary | 0.4 | 0.5 | 2.9 | 3.5 |
| Fried potato products | 0.2 | 0.1 | 1.1 | 0.7 |
| Ice-cream | 0.2 | 0.1 | 1.1 | 0.8 |
| Muesli and snack bars | 0.2 | 0.1 | 1.3 | 0.9 |
| Processed meat and products | 0.3 | 0.2 | 2.3 | 1.2 |
| Savoury pies and pastries | 0.1 | 0 | 0.7 | 0.3 |
| Savoury snacks | 0.3 | 0.2 | 1.8 | 1.6 |
| Sugars, sweetened beverages | 0.4 | 0.2 | 2.5 | 1.5 |
| Takeaway foods | 0.1 | 0.1 | 1 | 0.7 |
| Total | 3.4 | 2.4 | 23.9 | 17.1 |
Average servings per day and week
Below are some observations regarding the sample results.
- 73% of the participants are female.
- 47% of the participants are normal weight compared with 35% of the Australian population.
- 50% of the participants are overweight or obese compared with 63% of the Australian population.
- The dietary information is obtained by self-reporting which is unreliable.
- The sample is not a representative sample of the Australian population.
- Based on the weight status, the sample population is healthier than the Australian population.
- It is likely that health conscious people are more likely to participate in such a survey.
- The only health outcome measured is weight status.
- The discretionary food items have no nutritional value and are not beneficial. However, 20 points are added to the Healthy Diet Score for males that have less than 3 servings a day and females that have less than 2½ servings a day.
- 5 points are allocated if you trim fat from your meat – the same as if you always eat whole-grain breads. Are the health benefits of these two activities equivalent?
The reliability and validity of the Healthy Diet Score is discussed in a paper published in Nutrition & Dietetics (2017) 3. The score is used to “assess compliance with the 2013 Australian Dietary Guidelines”. In this context, reliability refers to the comparisons of two self-reported surveys performed one week apart. The validity is measured by “comparing the first administration [of the self-reported dietary survey] to the average of three 24-hour [self-reported] dietary recalls”. A better test of validity is to ensure that the Health Diet Score is a true reflection of health outcomes.
According to the paper, the
“validity analysis showed moderate correlation between SFS#1 and 24-hour recalls (ICC = 0.43 (0.21:0.62, P < 0.001)), with 51% agreement in allocation to tertiles of diet quality between methods (k = 0.262, P = 0.004). The survey overestimated the diet index score by an average of 12.7 points out of 100 [-20.11:42.94] in comparison to recalls”.
The ICC refers to Intra-class Correlations. The ICC shows how well two sets of data match each other. The result of 0.43 is usually interpreted as a fair correlation—not a moderate correlation as stated. Less than 0.40 is usually considered to be a poor correlation. There is only a 51% agreement in tertiles. This means that if the two set of results are divided into three categories (low, medium and high), then there is only a 51% agreement into which category the result lies. The survey overestimated the diet score by an average of 12.7 points which is a significant difference in the participant’s Healthy Diet Score. The range of discrepancy is -20.11 to 42.94 which is very large difference given that the HDS is a value between 0 and 100.
It is important to note that ICC only measures the how well two sets of scores match. It does not measure the most important criteria—how well the scores measure actual health outcomes.
The real test of validity, which is not addressed, is how closely the actual food intakes relate to health outcomes, as opposed to a theoretical dietary index.
This survey was used to justify the “Eggs are OK every day” campaign. 4
The following table shows categories of the average daily egg consumption with the average of the Health Diet Score.
| Daily Egg Consumption | HDS |
|---|---|
| Low (0-.0.3) | 55.6 |
| Low-Medium (0.3-0.4) | 58.2 |
| Medium (0.4-0.6) | 59.7 |
| Medium-High (0.6-1.0) | 60.5 |
| High consumption (> 1.0) | 61.3 |
| Non consumer | 57.7 |
Daily egg consumption compared with average HDS
The justification for “Eggs are OK everyday”, is that the as the egg consumption increases, so does the Healthy Diet Score.
However, the Healthy Diet Score has not been shown to be associated with an increase in health outcomes. Consider how minor the differences are in the HDS, especially given that the average discrepancy was 12.7 points between two self-reported surveys separated by only one week.
If the weight status is compared with the egg consumption and Healthy Diet Score, a different observation is shown.
| Weight Status | Eggs per day - male | Eggs per day - female | Mean Diet Score |
|---|---|---|---|
| Underweight | 1.04 (2.24) | 0.62 (1.20) | 59.6 (14.4) |
| Normal weight | 0.83 (1.34) | 0.77 (1.28) | 60.5 (12.6) |
| Overweight | 0.89 (1.65) | 0.83 (1.45) | 58.1 (12.5) |
| Obese | 0.98 (1.84) | 0.88 (1.58) | 55.7 (13.2) |
The mean egg consumption and mean HDS compared with weight status.
The standard deviation is shown in brackets.
Dairy, meat, fish, poultry are given positive ratings in the Healthy Diet Score despite Seventh-day Adventists’ studies consistently showing an improvement in health status as the diet becomes more vegan.5
| Category | % | BMI | Type 2 diabetes Odds ratio (*) |
|---|---|---|---|
| Vegan No red meat, fish, poultry, dairy, eggs | 4.2 | 23.6 | 0.32 |
| Lacto-ovo vegetarians Vegan with eggs and milk | 31.6 | 25.7 | 0.43 |
| Pesco-vegetarians Vegan with fish, milk and eggs | 11.4 | 26.3 | 0.56 |
| Semi-vegetarians Red meat, poultry less than once a week plus fish, milk, and eggs | 6.1 | 27.3 | 0.69 |
| Non-vegetarians Red meat, poultry more than once a week plus fish, milk, and eggs | 46.9 | 28.8 | 1 |
(*) After adjustment for age, sex, ethnicity, education, income, physical activity, television watching, sleep habits, alcohol use and BMI
These figures are after adjustment for BMI, physical activity and television watching which not independent variables.
Note that the comparisons are with Californian Adventists who are much healthier that the average Californian who are also much healthier than the average American.
The life expediencies of vegan Californian Adventist men and women are higher than those of any population studied. 6
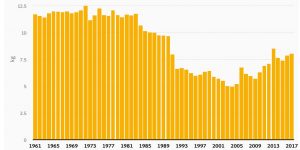
Egg consumption in Australia reached a high point in the early 1970s and decreased substantially until the early 2000s. 7 Whilst egg consumption has not reached the highs from the early 1970s, it has steadily increased since the early 2000s due to successful marketing campaigns by the Australian Eggs, such as “Eggs are OK everyday” and research funded by the poultry industry.
The Physicians’ Health Study commenced in 1981. As well as examining the role of aspirin and a beta-carotene supplement, on heart disease and cancer, it also examined the role of egg consumption on health. The result from a 20-year follow-up showed a significant correlation between egg consumption and all-cause mortality. A key finding is that physicians consuming 7 or more eggs per week had a 31% increase in all-cause mortality compared with those consuming less than 1 egg per week. For diabetic physicians, the association was much higher with the increase in mortality slightly more than doubled. 8
A British study reported a 2.7 times greater risk of cardiac deaths for those consuming 6 or more eggs per week compared with those consuming less than 1 egg per week. 9
Based on the above observations, the recommendation for “one egg a day” does not appear to be justified.
Related articles
CSIRO Healthy Diet Score and Egg Consumption in Australia
Eggs are Not OK
Eggs and the Benefits of Choline
Last updated on Monday 20 March 2023 at 23:11 by administrators

Footnotes
- Hendrie, G., Baird, D., Golley, S., & Noakes, M. (2016, September). CSIRO Healthy Diet Score 2016.
- Hendrie, G. A., Rebuli, M. A., & Golley, R. K. (2017). Reliability and relative validity of a diet index score for adults derived from a self‐reported short food survey. Nutrition & Dietetics, 74(3), 291–297.
- Hendrie, G. A., Rebuli, M. A., & Golley, R. K. (2017). Reliability and relative validity of a diet index score for adults derived from a self‐reported short food survey. Nutrition & Dietetics, 74(3), 291–297.
- Hendrie, G., Baird, D., & Noakes, M. (2016, October). Australians’ usual egg consumption. CSIRO Publications.
- Le, L. & Sabate, J. (2014) Beyond Meatless, the Health Effects of Vegan Diets: Findings from the Adventist Cohorts. Nutrients. 6 (6), 2131–2147.
- Fraser, G. E., & Shavlik, D. J. (2001). Ten Years of Life – Is It a Matter of Choice? Archives of Internal Medicine, 161(13), 1645–1652.
- Helgi Library (n.d.) Egg Consumption Per Capita in Australia | Helgi Library (Accessed 16 December 2020).
- Djoussé, L. & Gaziano, J. M. (2008) Egg consumption in relation to cardiovascular disease and mortality: the Physicians’ Health Study. American Journal of Clinical Nutrition. 87 (4), 964–969.
- Mann, J. I. et al. (1997) Dietary determinants of ischaemic heart disease in health conscious individuals. Heart. 78 (5), 450–455.
However, the study has been funded by the dairy and beef industries.
Discover how industry-funded research is deceiving the public.
 Carbohydrates DO NOT cause diabetes
Truth and Belief
 Discover why researchers, popular commentators and the food industry is more concerned with maintaining corporate profits than ensuring that we have valid health information.
Who is going to get wealthy by encouraging people to eat their fruit and vegetables?
Featured Posts
2040 DocumentaryPop Psychology, Alice and the Concept of Evil
The Pioppi Diet
What is the Problem with Wheat?
Wheat and Inflammation
Impact of a Gluten-Free Diet
Wheat and William Davis
Glucose Tolerance
When Vegan Diets Do Not Work
7th-day Adventists and Moderation
Taiwan, Buddhists and Moderation
Worried about eating eggs?
CSIRO and Egg Consumption
How Cooking Changed Us
Deception from The BMJ